
Medical billing KPIs are useful only when the practice can explain the question, population, period and calculation behind each number. Collection rates, claim measures, charge lag and accounts receivable measures describe different parts of the cycle. They should not be blended into one unexplained score or compared across reports that use incompatible definitions.

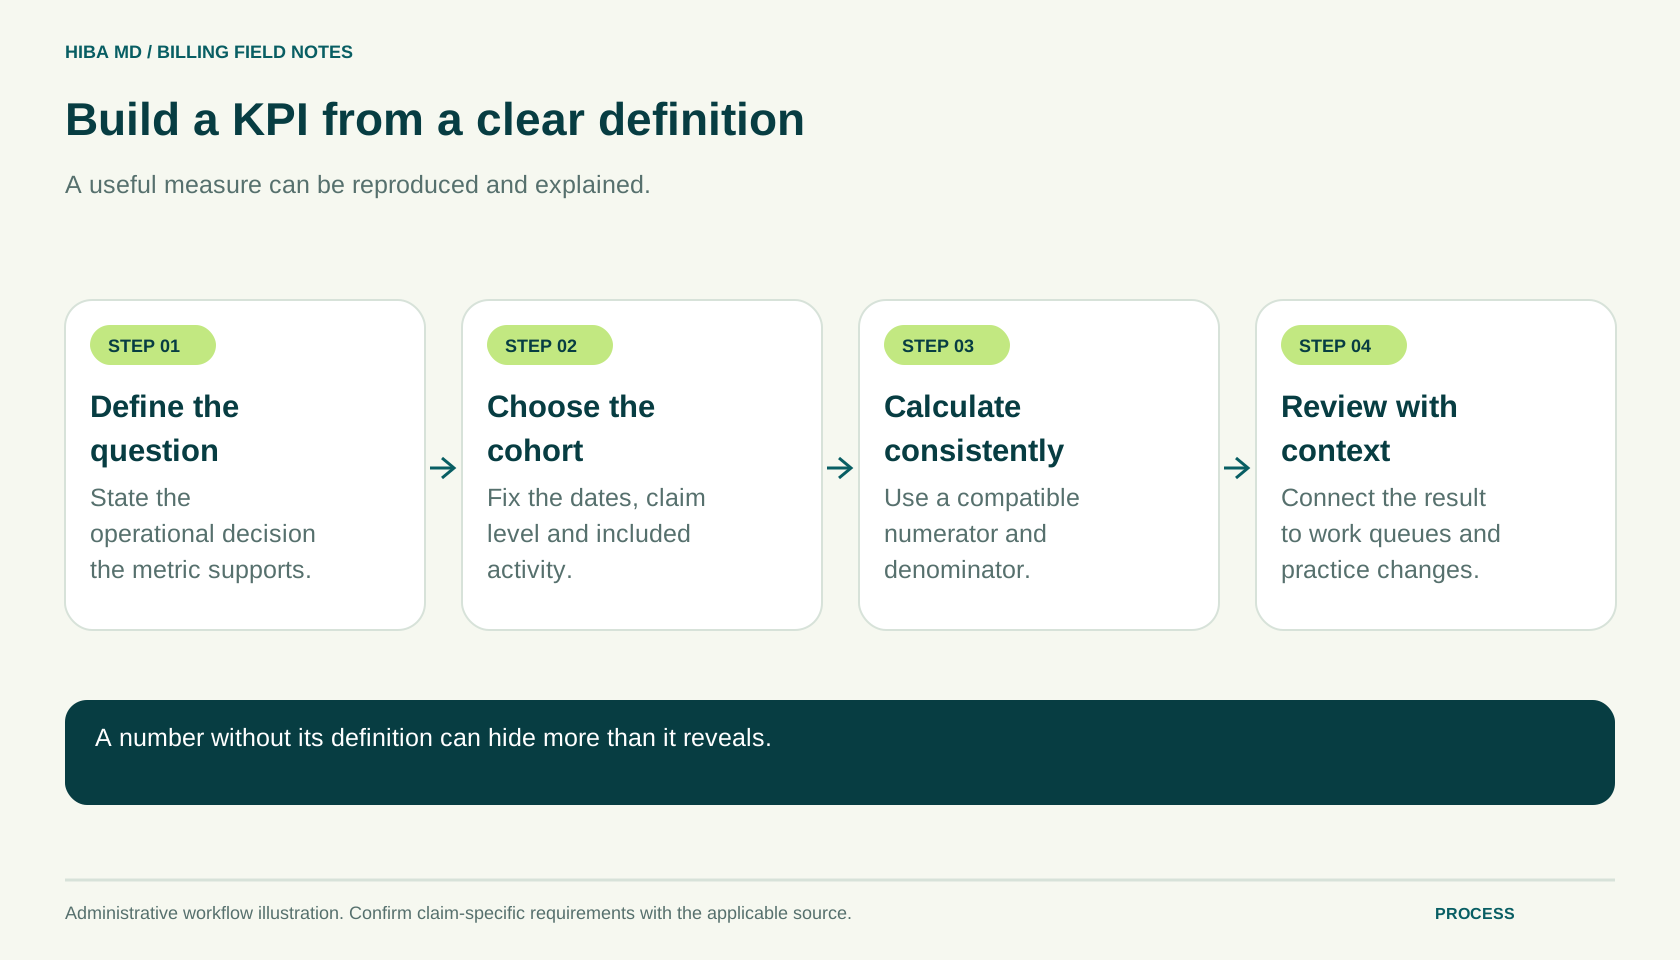
Start with the practical question
This guide helps practice administrators build a small, reproducible reporting set and connect it to actual work queues. All numerical examples are invented for arithmetic demonstration. They are not recommended targets, industry benchmarks, client results or forecasts. Use your own reconciled source information and document the definitions before interpreting a trend. A calculator can verify arithmetic, but it cannot decide whether the chosen population answers the business question.
Example dashboard for a monthly billing review
In this fictional dashboard, a practice reviews October claims and collections at the November close. Each row shows the value, its source and who will act on it. Keep a copy of the reports as of that cutoff, so later payments or claim replacements do not silently change the figures the team reviewed.
Net collection rate is 94.44% in the sample. The poster divided $85,000 in payments by a $90,000 net charge base for the same defined cohort. The posting lead will reconcile the underlying charges and contractual adjustments before comparing the result with September.
Claim denial rate is 8% in the sample. The denial lead counted 80 denied claims among 1,000 adjudicated claims. Their next action is to review the largest denial category and assign the correction or follow-up queue. Keep an explicit rule for partial denials and replacement claims.
Days in A/R is 45 in the sample. The practice divided $180,000 in receivables by average daily charges of $4,000. The A/R lead will open the aging report and identify balances without a next action. Each dashboard row can use the same columns: metric, period, numerator, denominator, result, owner and next review date.
Begin with the management decision
Name the question before selecting the metric. Are completed encounters reaching billing promptly? Are submissions being accepted at the relevant stage? Are payer responses creating recurring work? Are payments and adjustments reconciling? Are older balances waiting for evidence? Each question points to a different queue and needs a different measure.
Write the decision the report should support. If management wants to address documentation waits, a general collection percentage may be too distant from the handoff. A count of completed encounters by readiness status may be more useful. If the question is payment reconciliation, a deposit-to-posting exception view may tell the team more than an overall denial rate.
Limit the initial dashboard to measures the team can reproduce and act on. A large collection of charts can create work without improving decisions. For each selected KPI, identify an owner who understands the source and another owner who can act on the result. They may be different people. The reporting process should connect those roles rather than assuming a number automatically produces a corrective action.
Create a metric dictionary
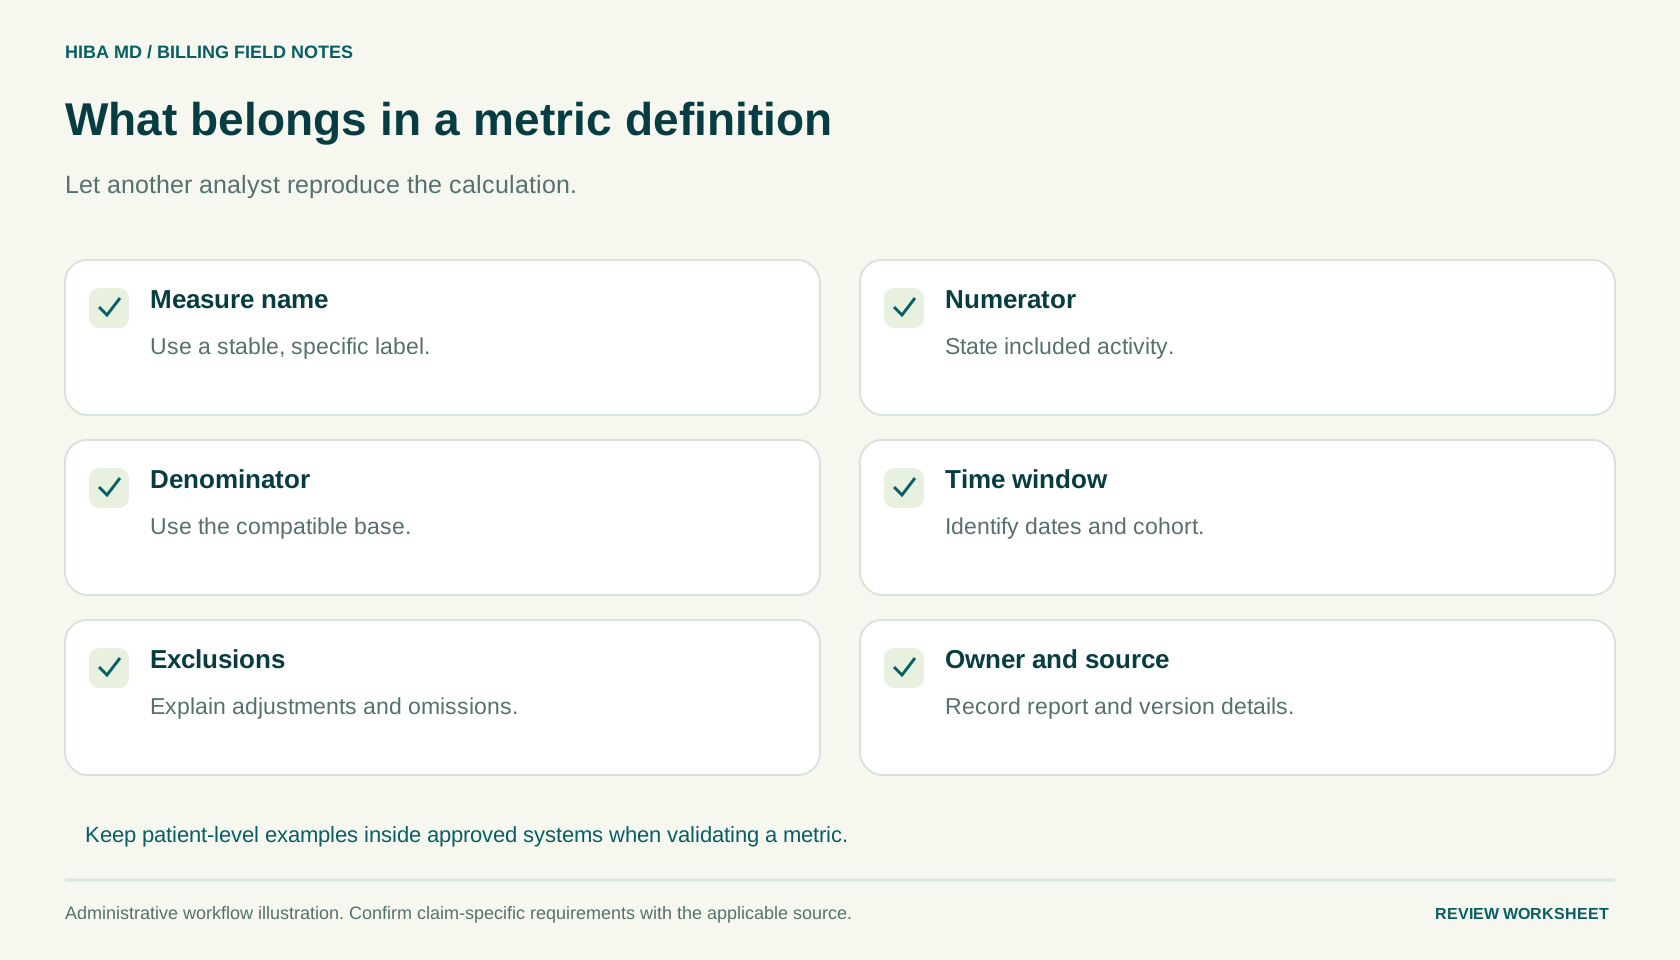
For every measure, record its name, business question, numerator, denominator, included population, reporting period, cutoff and exclusions. Add the system or report used as the source and describe how adjustments or reversals are treated. These details let another staff member reproduce the measure and explain why it differs from a similar-looking report.
Keep the unit consistent. A claim-count rate should not divide denied service lines by total claims unless the measure explicitly intends that relationship and explains it. Dollars and counts answer different questions. A small number of high-value items may create a large dollar effect, while a large number of low-value exceptions may create substantial workload. Both can matter without being the same KPI.
Version the definition when it changes. If the practice begins excluding a category or uses a different starting date, explain the break in the trend. Otherwise, a reporting improvement can be mistaken for an operational improvement. A short dictionary is a practical control: it reduces recurring arguments about numbers and makes management discussions about the workflow more precise.
Understand gross collection rate
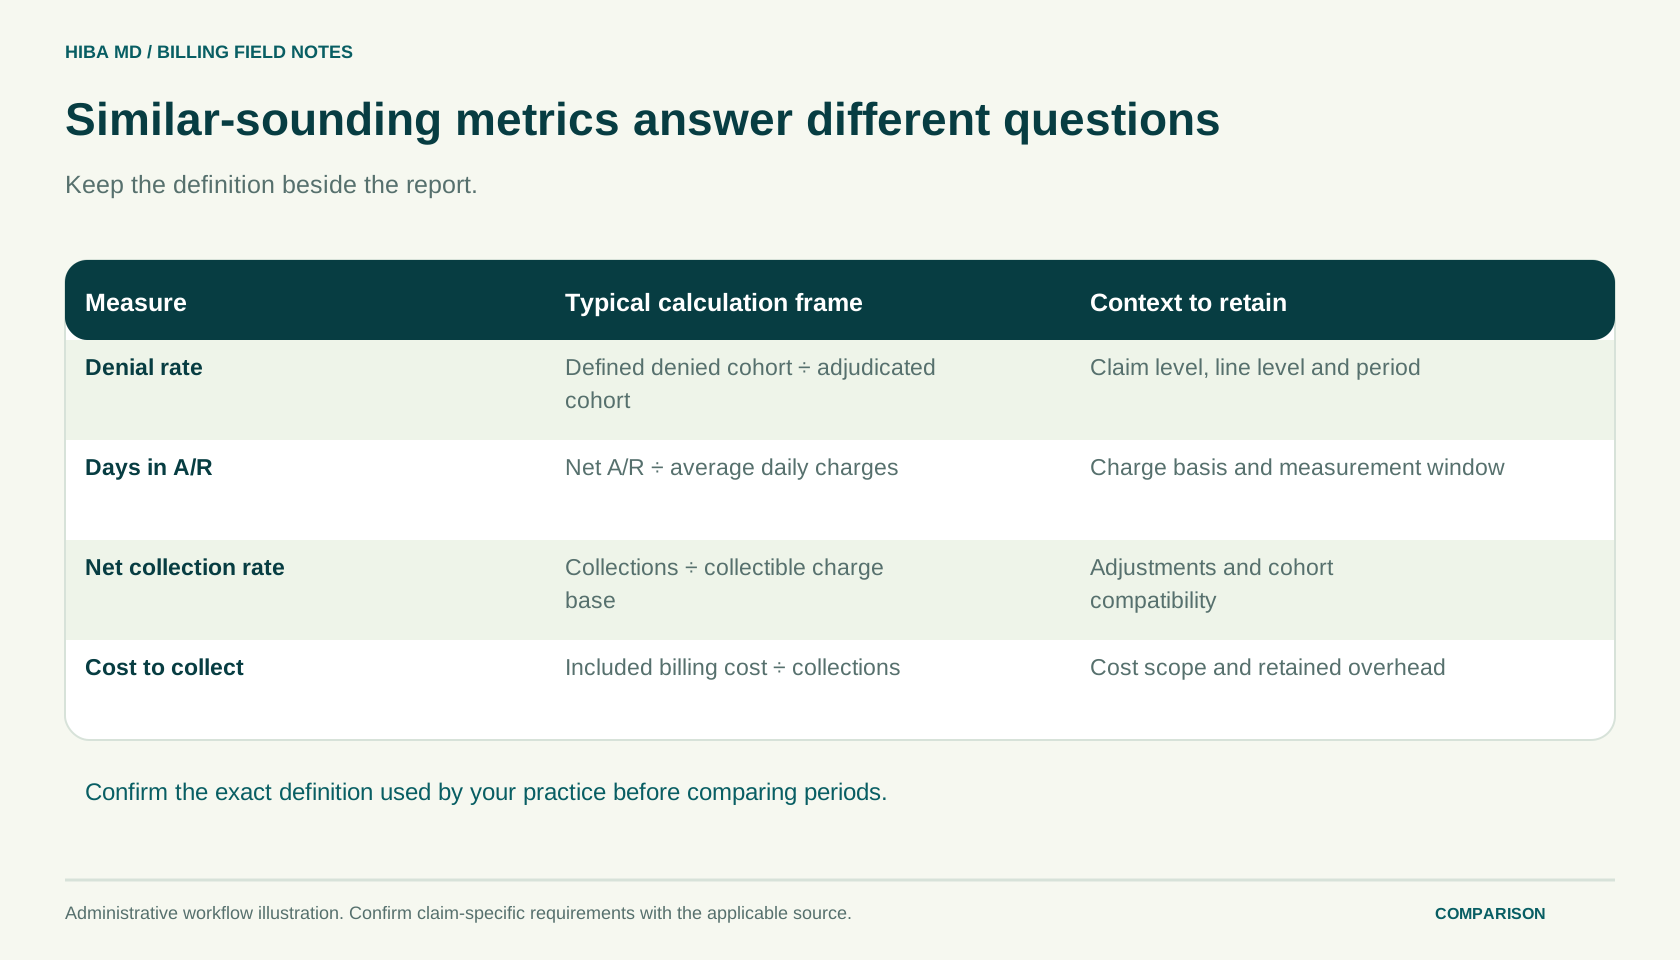
A basic gross collection calculation divides included payments by included gross charges and multiplies by 100. Using invented figures, $60,000 of payments divided by $100,000 of gross charges produces 60 percent. The interpretation depends on the population and timing. Gross charges may differ from the amounts expected under the practice's payer arrangements.
Do not treat the gap between gross charges and payments as automatically lost collectible revenue. Contractual adjustments and other supported account activity may explain part of the difference. A gross rate can be useful for a defined internal trend, but it does not substitute for reviewing expected amounts, contract terms or the status of individual accounts.
Timing also matters. Payments received this month may relate to services from an earlier period, while current charges may not have reached adjudication. State whether the calculation is a same-period cash view or follows a defined service cohort. The arithmetic can be correct while the interpretation is wrong if the report silently mixes different populations and presents the result as a payment-outcome rate.
Define net collection rate carefully
A basic net collection calculation compares included payments with a defined adjusted charge base. A common planning version subtracts included contractual adjustments from gross charges before dividing. If charges are $100,000, included contractual adjustments are $30,000 and payments are $63,000, the arithmetic is $63,000 divided by $70,000, or 90 percent.
The key phrase is included contractual adjustments. The practice must define which adjustments belong in the denominator and ensure they are supported and classified consistently. Removing every unpaid amount from the base can make a rate look strong without explaining what happened to the accounts. A useful reporting process reconciles the adjustment categories rather than treating them as a lever for improving a percentage.
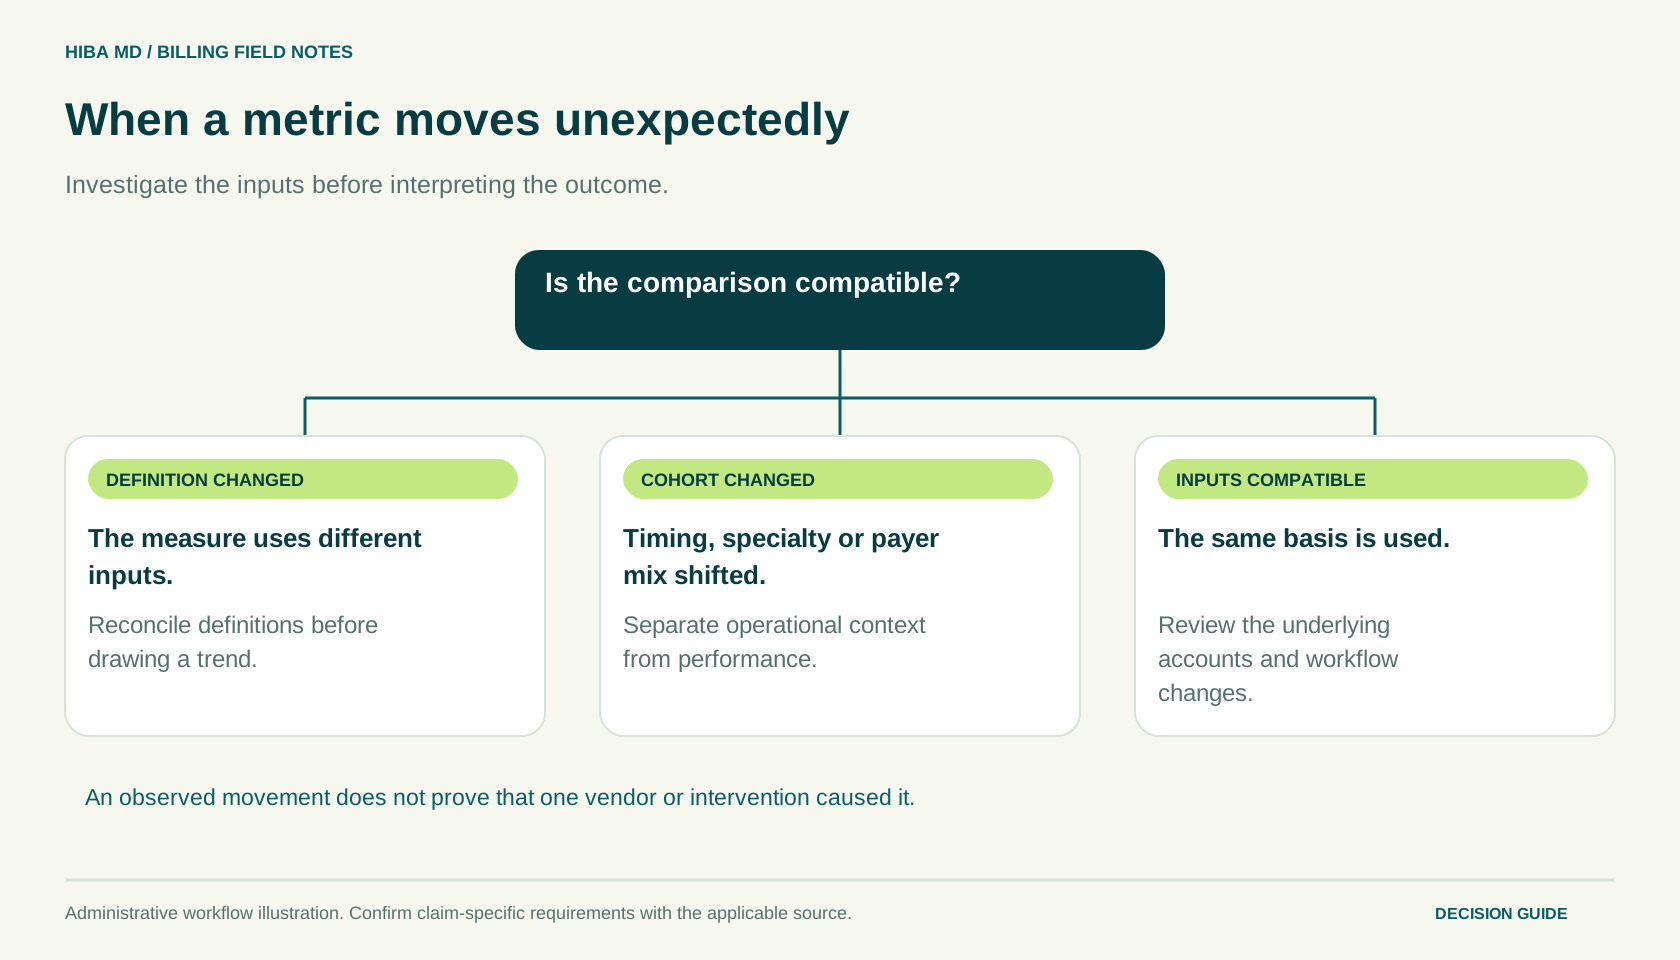
Keep the period and cohort visible. A rate above 100 percent can arise from timing or a mismatch in the selected populations; it is a reason to inspect the basis, not automatically proof of exceptional performance or bad arithmetic. Compare trends only after confirming that the sources, periods and adjustment treatment remain compatible. A displayed formula helps the team ask these questions explicitly.
Calculate days in accounts receivable
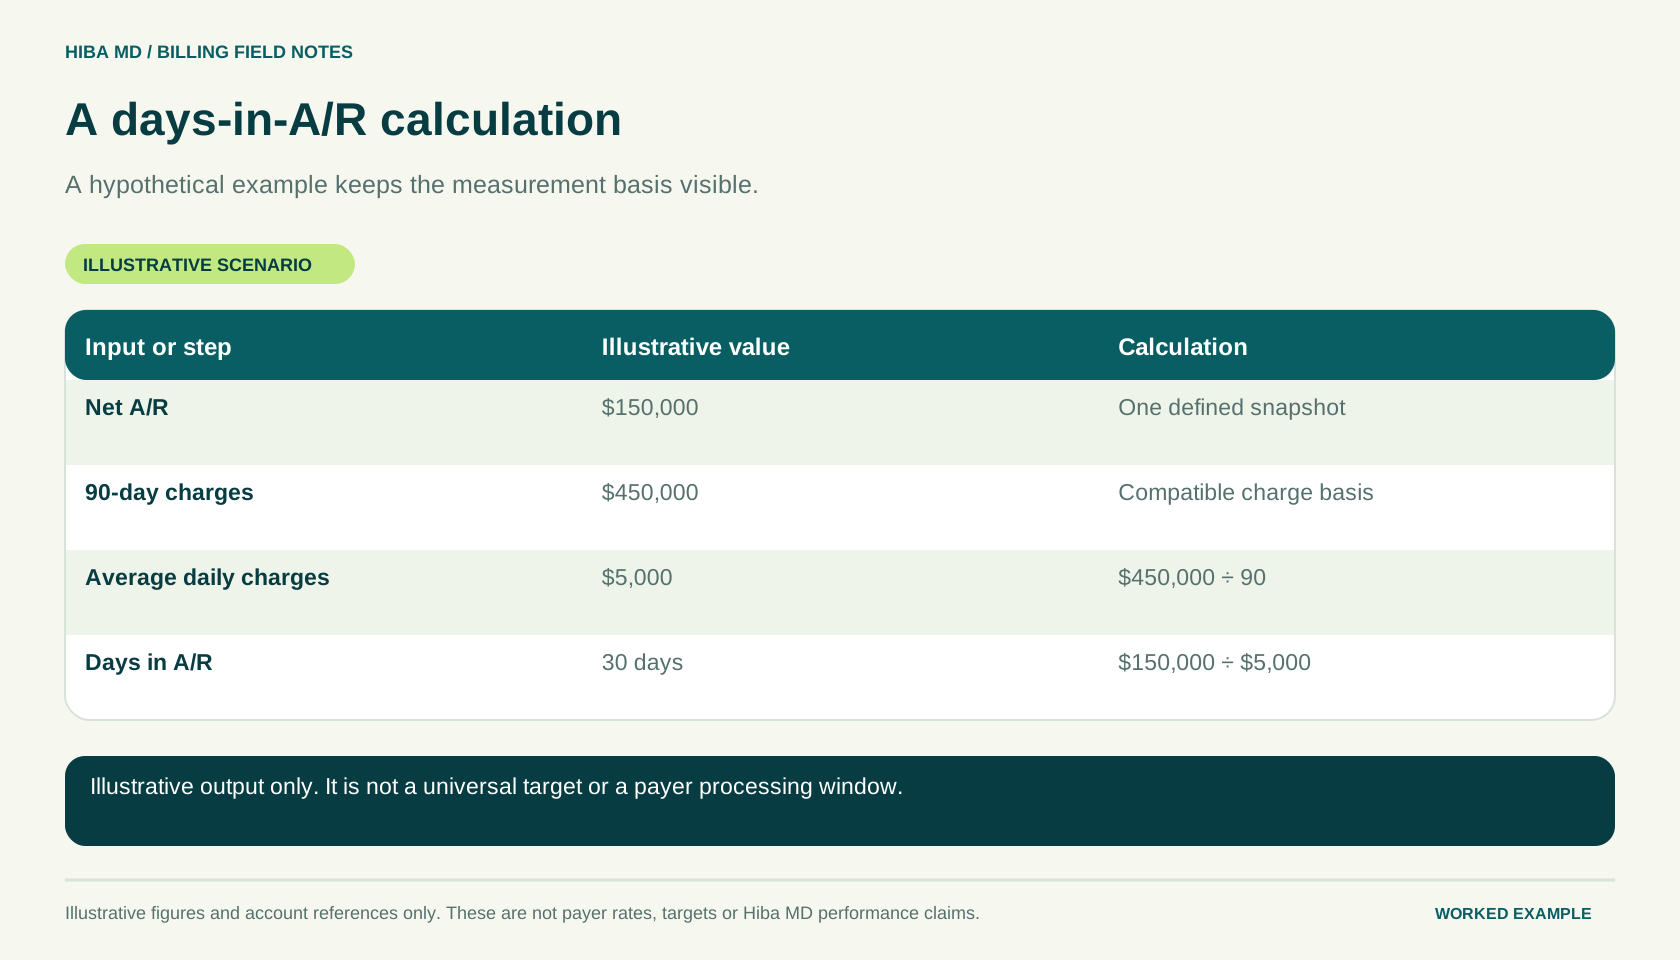
A simple days-in-A/R method divides the included receivable balance by average daily charges over a stated period. If receivables are $75,000 and average daily charges are $2,500, the result is 30 days under that method. Record how the daily average was derived and whether the denominator uses calendar days or another definition.
The result is a ratio, not the actual elapsed time of every claim payment. It can change when volume changes, when the charge period changes or when the receivable population changes. A growing practice may need additional context to interpret the trend. Likewise, excluding patient balances or credit amounts changes what the number describes and should be disclosed.
Pair the ratio with aging and issue categories. An overall measure can conceal a concentrated older-payer problem or a posting backlog. The Hiba MD calculator performs the entered arithmetic in the browser, but it cannot verify the ledger or determine collectibility. Use it to check the method and prepare questions, then use the reconciled source reports to understand the underlying accounts.
Read aging as a distribution
An aging report groups balances according to an agreed starting event and cutoff date. Define whether age runs from service, submission, statement or another date. Then explain which balances are included. Without those details, two reports can show different over-90-day totals while both are correctly applying different definitions.
Calculate both dollar and count views where useful. An invented $40,000 older bucket could contain a few large accounts or many small accounts. Those situations imply different workloads. Segment the bucket by issue and payer status before deciding the action. Age identifies a population to investigate; it does not establish why the balance remains or what disposition is appropriate.
Track movement with explanations. Payments, supported adjustments, transfers and newly aged accounts affect the distribution differently. A lower old-balance total is not necessarily evidence of cash recovery if amounts moved to another queue. A reconciled movement view helps management distinguish actual outcomes from changes in report classification and keeps the team focused on supported account resolution.
Separate submission measures from adjudication measures
An internal review pass rate, a transaction acceptance rate and a first-pass adjudication measure concern different events. Define the exact stage and what counts as success. A claim leaving the practice system is not the same as a claim accepted by every downstream stage, and acceptance is not the same as a final payment decision.
For an invented first-review measure, 480 passing claims out of 500 reviewed claims equals 96 percent under the selected definition. That number does not establish a payer outcome. For a separate adjudication measure, use a defined adjudicated population and outcome. Do not compare the two percentages as if they measure the same process or use one to support a broader claim than its definition allows.
Review excluded and pending populations. If difficult encounters remain on hold before the measured stage, a high pass rate may coexist with an expanding unfinished queue. Management should see what entered, what advanced and what remains waiting. Adjacent-stage reporting is more informative than a single polished percentage because it reveals whether work is actually moving through the cycle.
Define denial rate and denial workload
Choose whether the measure counts claims, lines or dollars and specify the response stage. A first-adjudication denial measure differs from a count of all adverse responses received during a period. Repeated responses on the same claim can affect the latter. The reporting dictionary should make those choices explicit so the team understands what changed when the number moves.
Using invented figures, 30 initially denied claims out of 600 adjudicated claims equals 5 percent. That rate does not describe the effort required to investigate them, the amount potentially affected or the outcome of later review. Add issue categories and current action statuses so the practice can identify recurring causes and the dependencies preventing resolution.
Separate prevention from recovery reporting. A reduced future exception rate and a payment on an existing denied account are different outcomes. Both may be useful, but they need different populations. If the practice changes an upstream registration step, review the intended issue in a later comparable group rather than attributing every movement in an overall denial percentage to that one change.

Measure charge lag with meaningful dates
Charge lag describes elapsed time between defined events, often service and charge entry or release. The exact definition matters. An average based on entry date may describe a different handoff from an average based on submission date. Specify the dates used and identify whether the measure includes encounters that are still waiting and have no ending event yet.
For an invented completed set with lags of two, three, three and eight days, the average is four days. The eight-day item deserves investigation, but the average does not reveal why it waited. Review documentation readiness, provider attribution, administrative information and review queues. Those causes point to different owners and should not be collapsed into a general statement that billing is slow.
Also show the unfinished population. A measure based only on completed items can overlook the oldest unresolved encounters because they have not reached the ending event. Pair the completed-item lag with a current readiness queue by age and reason. This gives management a more complete view and reduces the risk that a favorable average hides the work most in need of attention.
Estimate cost to collect and cost per claim
A cost-to-collect scenario divides included billing-related costs by included collections and expresses the result as a percentage. A cost-per-claim scenario divides included costs by a defined claim count. Both require a deliberate cost scope. Compensation, related employer costs, dedicated systems, external fees and retained practice expenses may be treated differently depending on the question.
Using invented inputs, $8,000 of included cost and $160,000 of included collections produces a 5 percent cost-to-collect scenario. The same $8,000 divided by 2,000 included claims produces $4 per claim. Those figures answer different questions and are not market benchmarks. Define whether repeated submissions are counted and whether the costs cover the same period and work scope as the denominator.
Use sensitivity analysis when comparing options. A fixed internal cost behaves differently from a percentage fee as volume changes. Some software or management cost may remain after outsourcing. The worksheet should distinguish current cash spending, avoidable cost and replacement capacity. A precise formula cannot compensate for an incomplete scope, so review the inputs before interpreting the difference as a saving.
A practice with $7,200 in billing costs and 1,200 unique processed claims reports $6 per claim. If another 180 transactions were resubmissions of those claims, dividing the same cost by all 1,380 transactions gives $5.22 per transaction. Keep the unique-claim measure for comparisons with a vendor that quotes per claim. Use the transaction measure when reviewing the time and volume handled by the team.
Reconcile source reports before publishing the dashboard
Assign a reporting owner who checks totals against the underlying systems and explains differences. Charges, payments, adjustments and balances should connect under the selected definition and cutoff. If a report uses a different period or population, state that difference. Do not force two unrelated totals to match by silently excluding inconvenient categories.
Keep a compact validation record: source report names, run date, period, included entities or locations, known exclusions and reviewer. This does not need to become a burdensome project. It gives the next person enough context to reproduce the number and prevents the monthly review from depending on one individual's undocumented export settings.
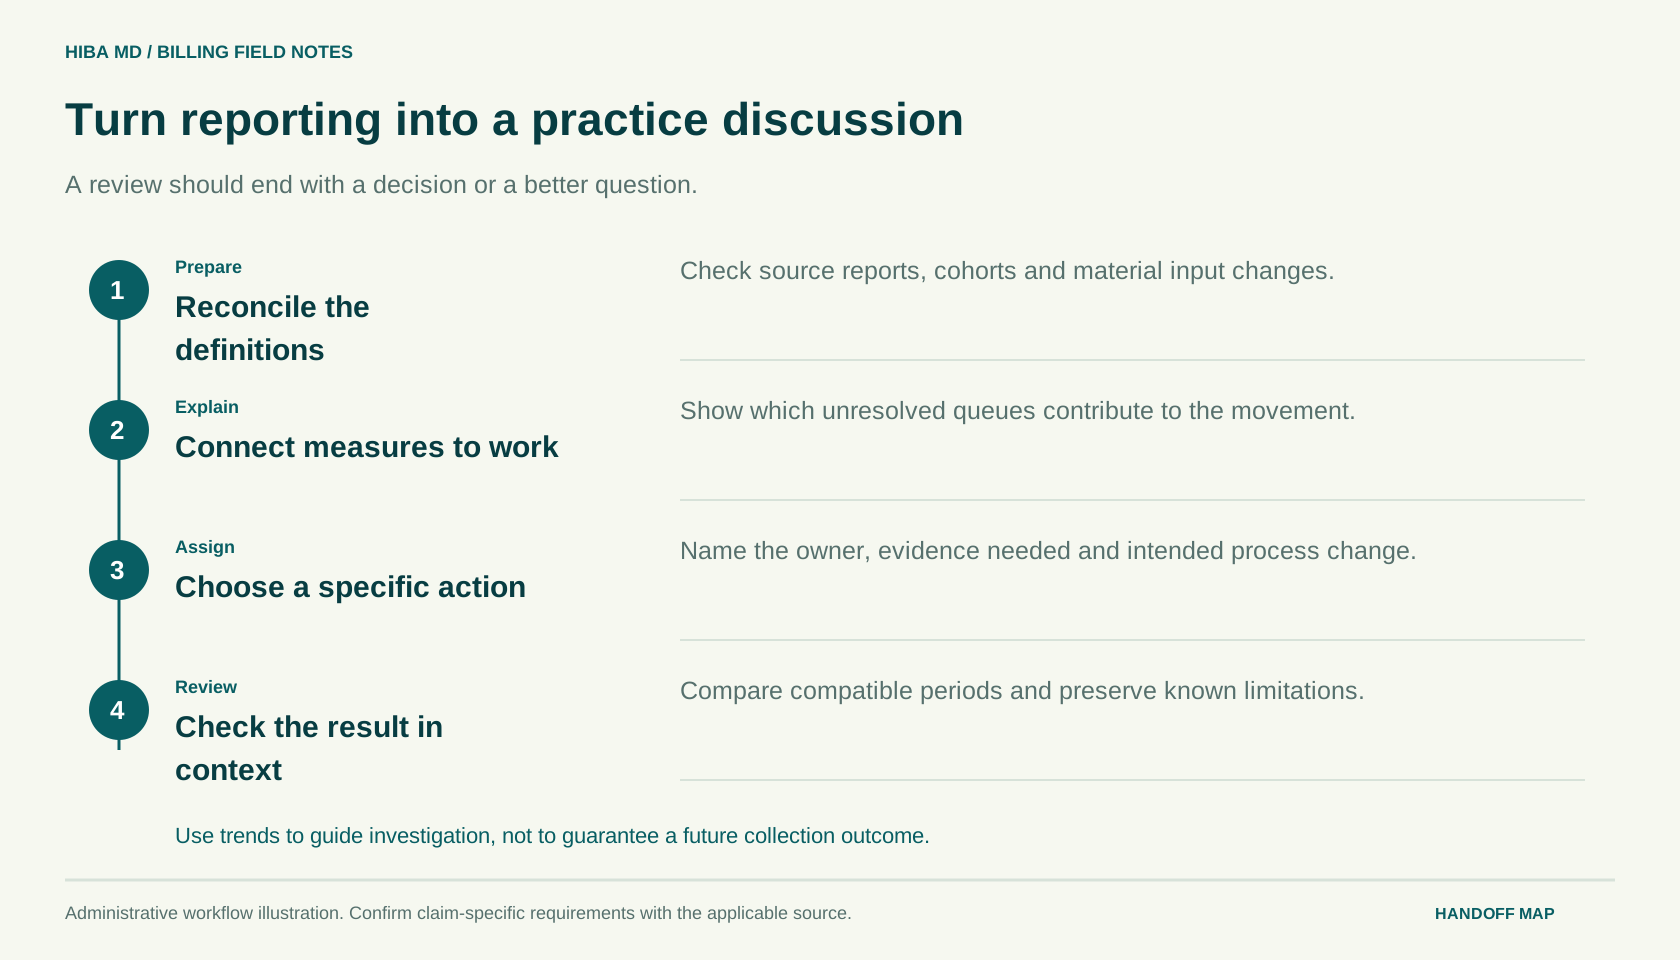
When a discrepancy appears, investigate whether it is a reporting issue, a posting issue or an actual operational change. Those possibilities require different actions. A dashboard is a decision aid built from source information, not a substitute for it. Management should be able to move from the chart to the relevant queue and understand what evidence supports the interpretation.
Connect each KPI to a work queue and an owner
For each measure, write the action question it can trigger. A rising documentation-wait count points toward the readiness handoff. A growing submission-exception group points toward the actual response causes. An unreconciled deposit difference points toward payment investigation. An older-payer bucket points toward issue classification and follow-up. The response should fit the stage the metric describes.
Use a short management agenda with a decision log. Record the finding, evidence, owner, next step and review date. If the team needs more information before deciding, identify the source being consulted. This keeps the review from becoming a recurring presentation of the same chart with no change in responsibility or account status.
Do not reward a metric in isolation from the supported work. A reduced balance can result from an unexplained adjustment, while a lower denial rate can result from fewer claims reaching adjudication. Review adjacent stages and account dispositions so the practice understands what happened. The purpose of measurement is better decisions and a more visible process, not a more flattering slide.
Use targets as local management choices
Separate a target from a benchmark and a guarantee. A local target can help the team plan a review cadence or reduce a defined backlog. An external benchmark needs a compatible population and credible source. A guarantee is a stronger claim about an outcome that may depend on parties and conditions outside the practice's control. Do not use those terms interchangeably.
Start with a reconciled baseline and choose a specific improvement question. If the practice wants faster documentation handoffs, define the current queue and the step being tested. Review a later comparable period and explain volume or definition changes. A transparent local comparison is more useful than borrowing a headline percentage that uses a different specialty, payer mix or reporting method.
Hiba MD offers free browser-based calculators, a free billing audit conversation and one month of medical billing services free, with no conditions. Bring your metric definitions and aggregate source totals to the initial discussion. The aim is to connect the number with the actual workflow and agree a practical next step, without inventing a collection forecast or claiming that a calculator verifies your payer records.
Reproduce a metric without the original report owner
Give another staff member the metric dictionary and ask them to reproduce one measure using the stated source, period and exclusions. Do not provide undocumented verbal shortcuts. If the result differs, compare the source settings and definitions before deciding which number is correct. This exercise tests whether the method is transferable and reveals assumptions that may have been clear only to the person who originally built the dashboard.
Record the reason for each difference. A cutoff date, excluded location, adjustment category or unit choice can change the answer. Those findings belong in the definition or source instructions, not only in the meeting notes. A reproducible method makes later reporting more efficient because the team spends less time rediscovering why two versions differ and more time investigating the actual operational question.
Repeat the exercise after a major system or report change. A familiar chart title can conceal a different population or calculation when software is replaced. The practice should understand whether the new series is comparable with the old one and explain any break. Visual consistency is helpful, but it is not evidence that the underlying method remained the same.
Test a denominator change with invented figures
Suppose 20 claims in a defined group receive an initial adverse outcome. Dividing by 400 adjudicated claims gives 5 percent. Dividing the same 20 by 500 submitted claims gives 4 percent. Both calculations use the same numerator, but the denominators describe different stages. Neither should be labeled without explaining the population. The example shows how a better-looking number can result from a method change rather than a change in the underlying responses.
Now suppose the count of reviewed claims changes because one location is excluded. The resulting rate may be valid for that narrower group, but it should not silently replace the earlier whole-practice series. Keep the scope visible and identify whether management is asking about the practice, a location, a specialty or a payer product. A denominator should reflect the business question, not be chosen because it produces the preferred percentage.
Use the exercise in dashboard training. Ask staff to identify the missing context before interpreting the result. This builds a useful habit: inspect the stage, unit, period and population before explaining why a rate moved. The habit is valuable across collection, denial, acceptance and productivity measures because each can be mathematically correct while answering a different question from the one management intended.
Separate a current snapshot from a service cohort
A current snapshot shows the position at a cutoff under a stated definition. A service cohort follows a defined group over time. An A/R snapshot, cash received during a month and outcomes for services delivered in that month are not interchangeable views. The practice may need more than one, but the report should explain which question each one answers and avoid combining them into an unsupported outcome claim.
For an invented cohort of 100 encounters, track what happens to those same encounters at later review dates. New services do not enter that cohort simply because they arrived before the next meeting. In a current operational queue, by contrast, new work does enter. The difference matters when evaluating a cleanup project or process change. A growing current total may coexist with progress on the original cohort.
Keep transfers, adjustments and payments distinguishable in both views. A cohort can appear resolved if items move elsewhere, while the continuing work remains open in another process. Identify the owner of those transferred questions. A reporting boundary should help the practice understand the work, not create a place where an account loses visibility because neither team considers it part of its current population.
Review the dashboard for unintended incentives
Ask what behavior each measure encourages when read without context. A pure submission-volume target might discourage investigation of missing evidence. A reduced-balance target might be misread as pressure to apply unsupported adjustments. A contact-count target might encourage repetitive calls that do not change the account state. These are reasons to design a balanced review, with source quality and supported dispositions visible alongside activity.
Pair the measure with a practical question and an exception route. If staff encounter an item that should not move forward without review, the process must allow them to show that dependency rather than hide it to protect a rate. Management should recognize accurate issue identification as useful work. An unresolved but well-owned question can be more informative than a superficially completed item whose source cannot be explained.
Periodically inspect a sample behind the headline. Confirm that the accounts and actions support the interpretation presented. This does not require auditing every transaction at every meeting. It requires enough connection between the dashboard and source evidence to notice when a metric begins rewarding a shortcut or concealing a growing adjacent queue. The resulting review is more credible and more useful for the practice's actual decisions.
When sharing a dashboard outside the immediate operating team, retain the definition notes and avoid presenting a scenario as an achieved result. A calculated annual difference based on unchanged monthly inputs is a projection under assumptions, while reconciled cash received is a recorded event. A local target is different again. Clear labels help readers understand those boundaries without needing to reconstruct the worksheet. They also make the report easier to update because the practice can change an assumption, explain the effect and preserve the distinction between what was calculated, what was observed and what management hopes to improve.
Frequently asked questions
Which medical billing KPI matters most?
The most useful measure is the one that answers the decision your practice needs to make and connects to an owned work queue. Documentation waits, submission responses, payment reconciliation and older balances require different views. Begin with the observed issue, then select a measure with a reproducible definition.
Can collection rates exceed 100 percent?
They can under some timing or population combinations, such as payments related to earlier services divided by a current-period adjusted charge base. Inspect the source, period and cohort before interpreting the result. It is not automatically proof of superior performance or a calculation error.
Is a lower A/R balance always an improvement?
Not necessarily. Payments, supported adjustments, transfers and report-scope changes can all reduce a displayed balance. Reconcile the movement and explain the account dispositions. A lower number without that context does not establish cash recovery or show whether the underlying questions were resolved appropriately.
Should we compare our rate with another practice?
Only after understanding whether the populations, periods, units, service mix and adjustment treatment are compatible. A superficially similar percentage may answer a different question. Use external comparisons carefully and keep your own reconciled trend and operational context visible when making management decisions.
What do the Hiba MD calculators verify?
They perform visible arithmetic or organize entered information in your browser. They do not connect to payer systems, validate your ledger, establish collectibility or guarantee future results. Use them to inspect assumptions and prepare a better discussion of the source reports and actual work queues.
Sources and editorial notes
Written by the Hiba MD editorial team. Reviewed 2026-11-18. Worked examples use illustrative figures, not client results or performance benchmarks. This guide explains administrative workflows; check current payer requirements for claim-specific decisions.
